How to find and see things in browser console
Browser console errors and warnings is the ideal starting point to troubleshoot if you are facing any error with your website. More often than not, it points to the exact line of the code that is creating the problem.
In this article, we are going to help you know more about the browser console. We will show you how to open the console, difference between warnings and errors as well as how to use the console filter. At the end you will know how to see only errors or some specific requests.
Chrome, Chromium and Iron browsers
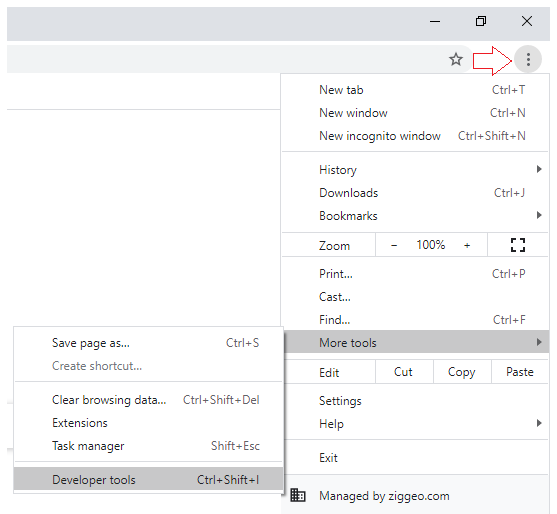
As shown in below screenshot, click on the three dots present at the top right of browser window. Once you do, click on the "More Tools" and finally the "Developer Tools". The keyboard shortcut for the same is Ctrl + Shift + I.
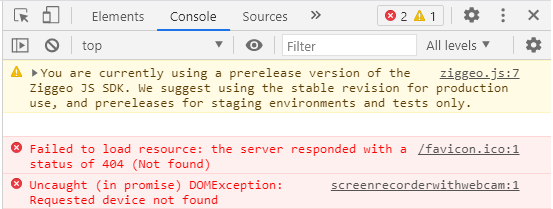
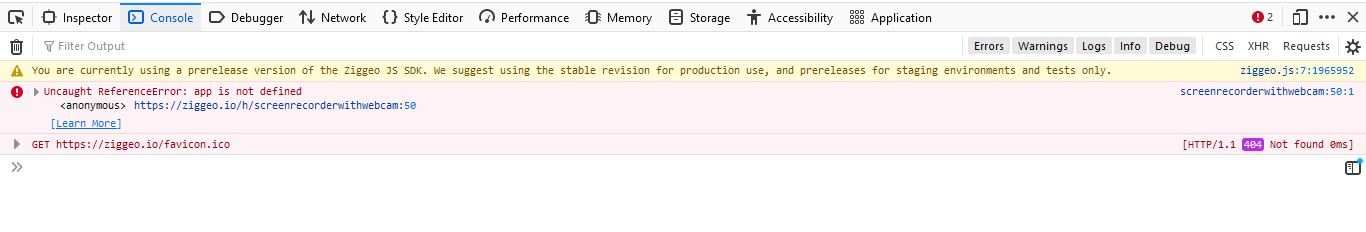
This is how the console looks with few examples of warnings and errors.
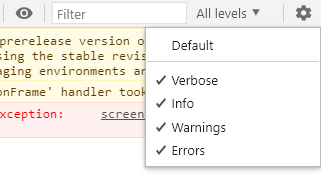
If you click on the dropdown icon named All levels, it will give you the option to filter down only errors/warnings or see verbose details.
Firefox
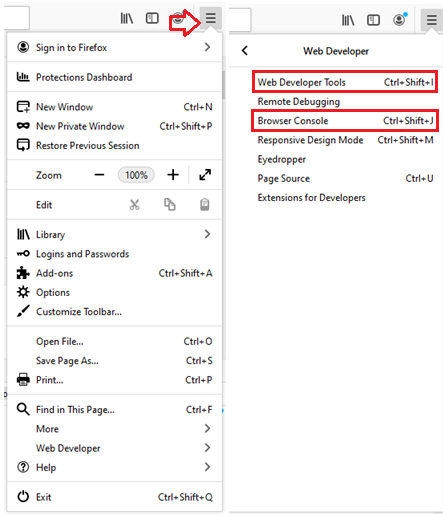
In Firefox, you would click on the "hamburger" icon in the top right. From there you would click on "Web Developer". If you see the Menu then this will be under Tools (Tools > Web Developer).
You can also open browser console using Ctrl + Shift + J or Ctrl + Shift + I to open Web developer tools. The below image shows how to open the same using browser menu.
This is how the console looks and displays information.
Edge
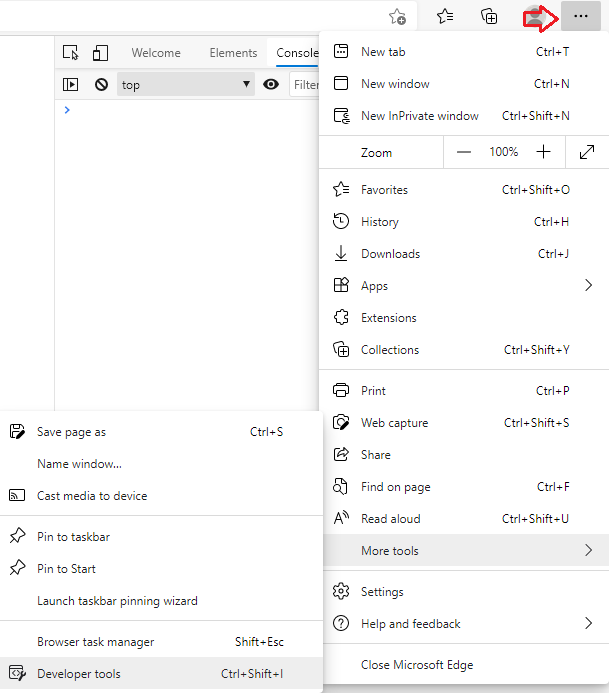
On Edge, you would click on the three dots in the top right corner. At that point you will see "More Tools" in the menu and under there you will see "Developer Tools". The keyboard shortcut to be used is Ctrl + Shift + I. The below image shows how to open the same using browser menu.
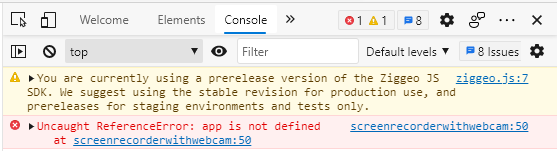
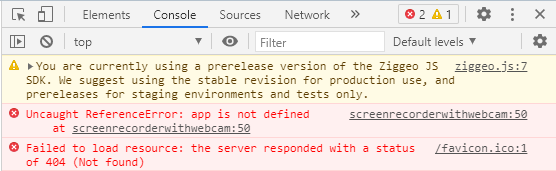
This is how the console looks and displays information.
Opera
The keyboard shortcut for the same in Opera is also Ctrl + Shift + I. Below is how the console looks and displays information.
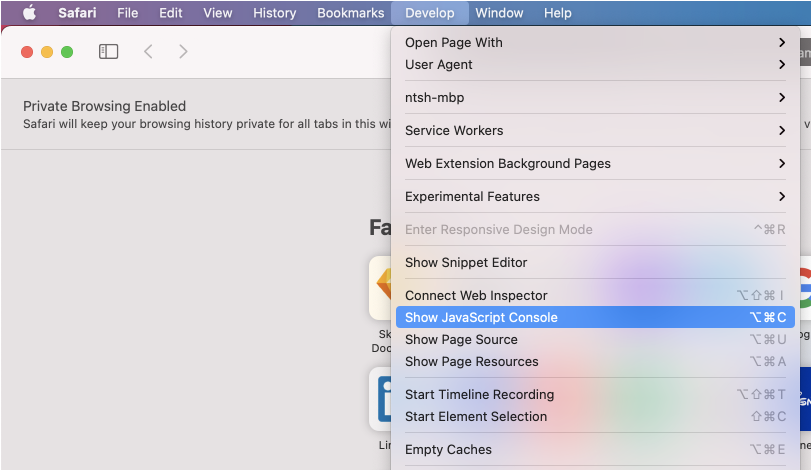
Safari
When you open Safari you will see Develop menu under which there is "Show JavaScript Console" option. The shortcut for the same in Safari is Shift + ⌘ + J.
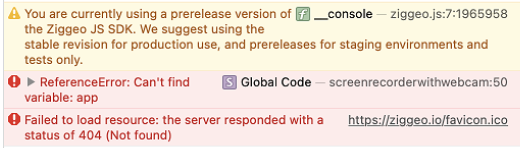
Below is how the console looks and displays information.
How to read the console entries
You have probably noticed that the consoles look quite similar for different browsers. The standard notation for each is that there are warnings, requests and the errors. A typical console would appear as in examples above. The warnings are marked with yellow color and have a triangular icon. The errors are colored with red .
Warnings are providing you with some information. They generally show up to let you know of something that you might want to look into in near future. The Errors on the other hand would point to the reasons why your page might not be loading.
Ideally you can have any number of warnings and no errors. Good thing if you do have errors is that you can resolve them easily. Just copy the error and share it with a developer and you are that closer to the resolution. If you think that error is connected to our service, just send it our way at support@ziggeo.com