Pulling Back the Curtain for Ziggeo’s Playback Data
Check into your dashboard and check out how many playbacks were viewed on different devices, which countries are utilizing the playback function the most, and even what language was used. Armed with this data that we have gathered and organized, you will be able to tell how users are watching videos and know how to best grab their attention.
Through the Playback Dashboard View, you can:
- Adjust the time frame to see Playback data from the last day, week, month, year, as well as custom time frames as metrics to measure success.
- If your business has set the goal of engaging more mobile customers, the organized data allows you to carefully look at how your community has embraced mobile playbacks over a specified time frame.
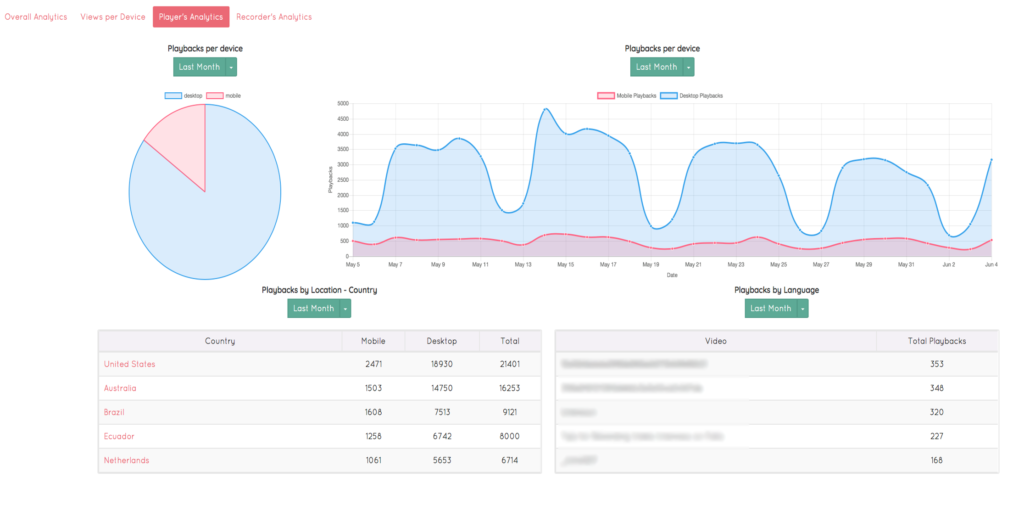
- Determine where videos are watched with Playbacks by Location:
- See where your customers are based, and if that measures up to your expectations. It could help inform your marketing team on which locations to focus advertising on.
- Understand differences among devices with the Playbacks per device pie chart:
- The pie chart gives an overview of which device customers seem to favor when they are watching recorded videos. This also provides insight into the method by which videos are recorded. For example, if the community videos were filmed with the intention of being viewed primarily on mobile devices, but like the data shown in the diagram, shows the opposite (about 80% of Playbacks took place on desktops), then it might prove valuable to look into that disparity. Similarly, these data points could inform your business about which devices to prioritize and how to best structure your viewing platform to ensure the most streamlined customer experience.