Ziggeo’s Dashboard Data and the Relationship Between Recordings and Playbacks

Ziggeo is able to gather information on how your users are interacting with our software in recording and watching videos. Ziggeo’s dashboard data is here to help you: 
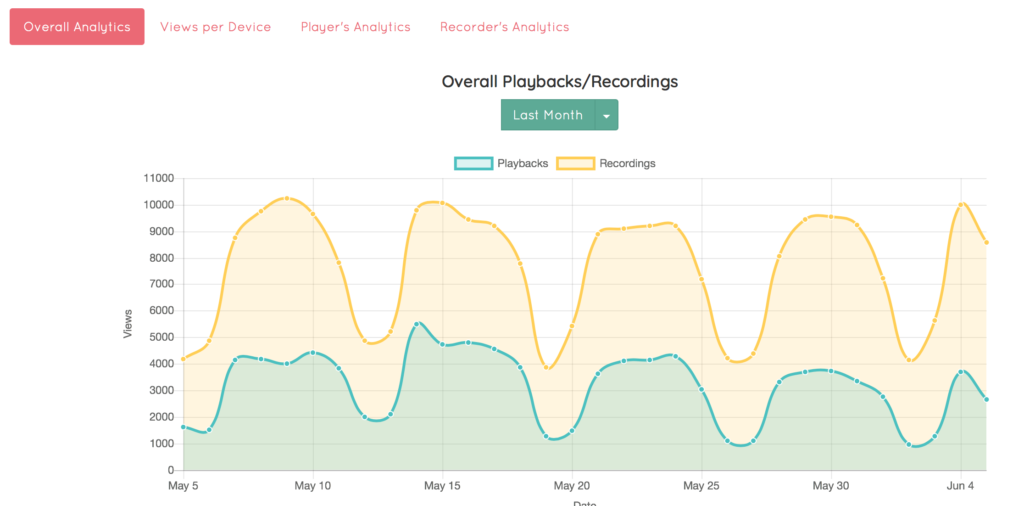
1) Identify any time differences from the time a video is recorded to when it is viewed; 2) Inform trends in recording and playback frequencies; 3) Answer questions you have about how many users are using Ziggeo’s software every day; 4) Grow your business as you incorporate our seamless video API; and 5) Oversee the aggregate data on how your community records and playbacks video each day.
How to Read and Interpret the Graph
If your data looks like the diagram above, you can tell that far more customers are recording videos than there are those who are watching them. It shows that for every video playback there are about two videos recorded. These findings could suggest that people are recording their videos multiple times before submission. If this were the case, this could inform job recruiters about how their candidates are approaching the question, or it could provide valuable insight to dating apps about how their customers are recording themselves. Alternatively, it can also suggest that not all the videos that have been recorded are being viewed. This could also prompt further research into what exactly is causing this disparity between overall playbacks and recordings. Perhaps there are more community videos being recorded during a large event than there are those being watched. Overall, these data points provide valuable insight that has immense potential in informing your business decisions and priorities.
PREV NEXT