Viewing Habits Can Reveal Customer Trends
Know what your customers want before they do. Our analytics are not only able to show you how many of your customers view our software, but also how many are viewing our recording and playback API each day, and how those trends are different among mobile and desktop users. Learn your customer's habits and work around their preferences to grow your business.
What This Data Shows
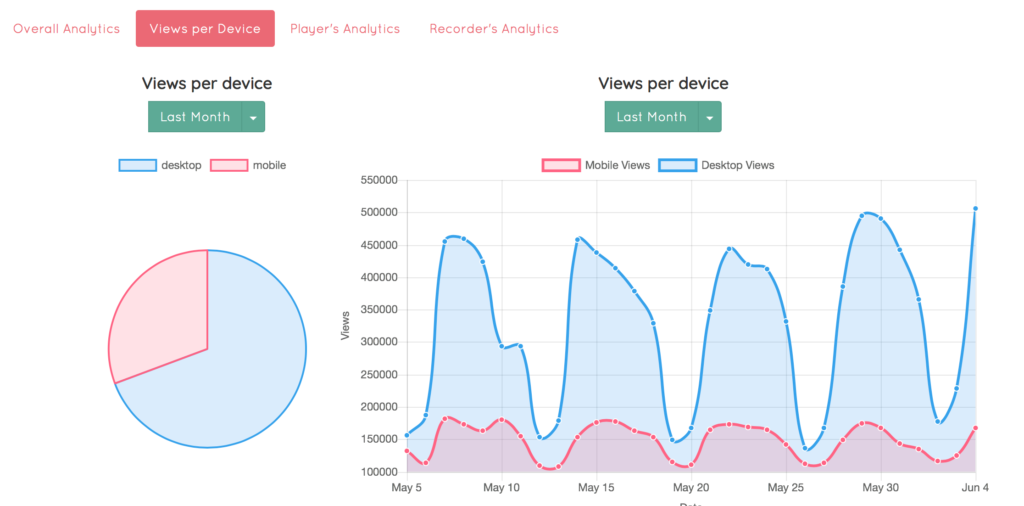
- Views per device (pie chart)
- The pie chart gives an overall look at how your customers are accessing the video recorder differently on each mobile device. The data shown above could show how your customers first access the recorder, which could be compared to the method by which the video is ultimately recorded or watched. You might be surprised at how your community uses mobile versus desktop. For example, views per device might reveal that about 40% of customers access the platform through their mobile device, but that only 10% of customers ultimately record videos on their phones. This could suggest that people feel the need to record their videos on a desktop.
- Views per device (graph)
- Just like the pie chart, this graph distinguishes between mobile and desktop users, but this provides more insight into how many users are active each day. To read this data, we can use this diagram to read how the views spike among users of both devices, which shows how users may access the technology more during the weekdays than the weekends. It also shows that more people are viewing the video recording/playback platform with their desktops than with their phones on any day of the week. This information could prove useful to your business for tracking the numbers of users that access Ziggeo’s technology over time and could inform future decisions about incorporating video technology.